Traffic data

General considerations

LA,eq,1h calculation:

  • The calculation of the LA,eq,1h needs the knowledge of the number of passenger cars (PC) and the number of heavy trucks (HT) on a 1h-period.

LA,eq,24h (and Lden) calculation:

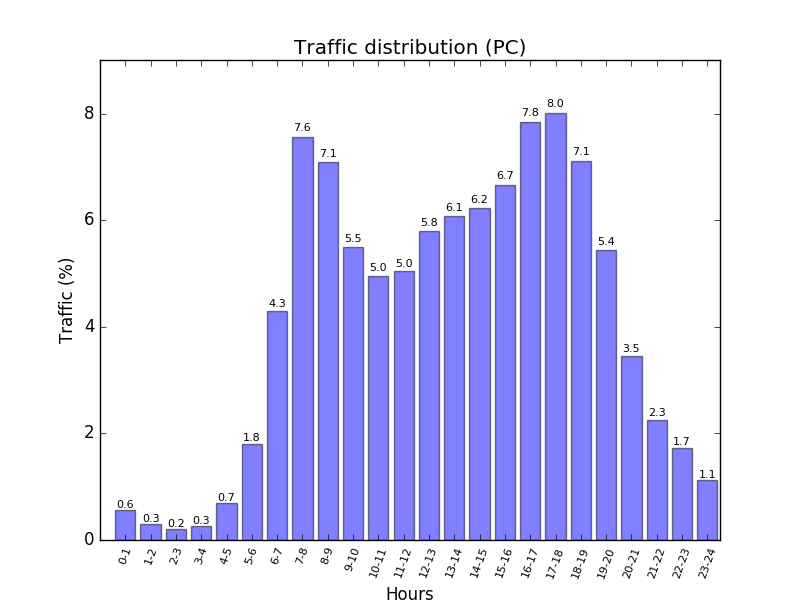
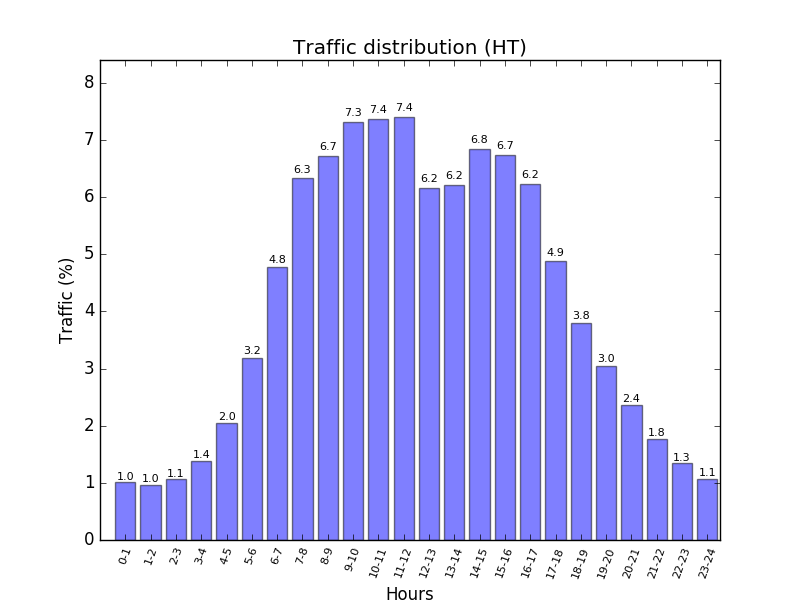
  • The LA,eq,24h calculation needs the knowledge of the number of passenger cars (PC) and the number of heavy trucks (HT) for every hour of the day.
  • In order to be as representative as possible of a yearly-averaged day, only working days are considered (from Monday till Friday).
  • Within the DEUFRABASE, a mean behavior of the traffic flow of PC and HT can be considered, as well as, user-defined traffic data.

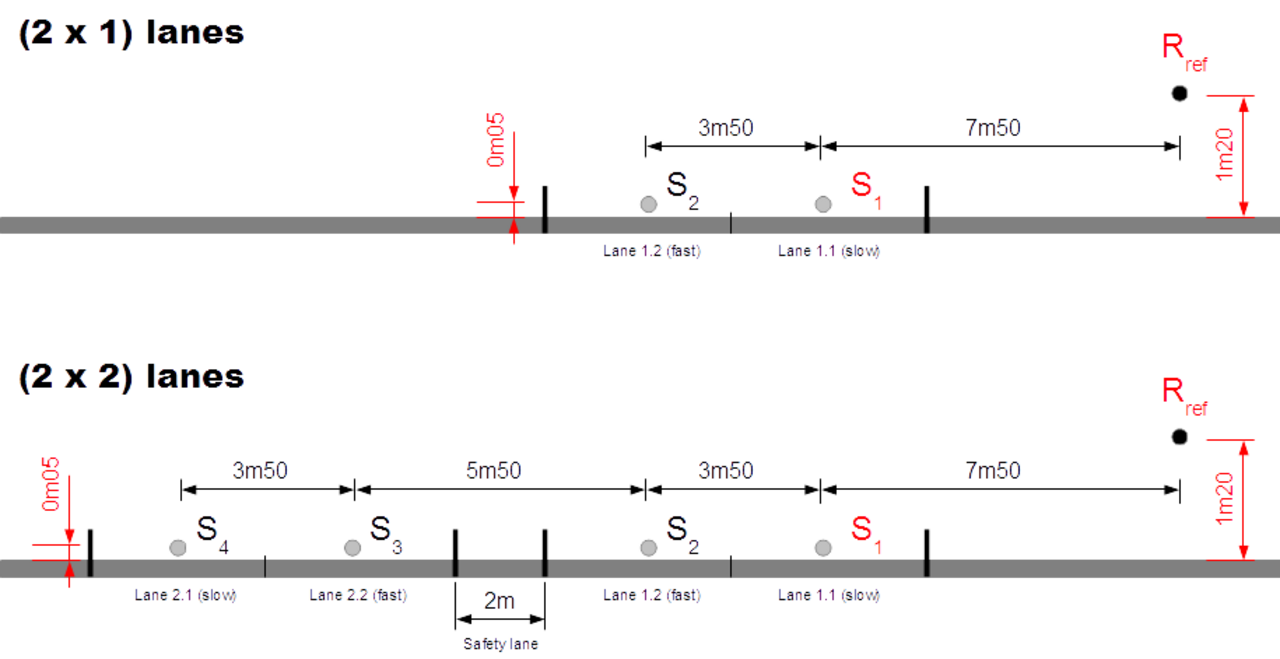
For both calculations, one need to consider the distribution of the PC and HT traffics on the road lanes:

  • Two representative road situations are considered: (2 x 1) and (2 x 2) lanes. The width of each lane is 3.5m. In the (2 x 2) lanes case, a safety lane of 2m width is considered between the two directions.
  • By default, the distribution of vehicles per lane (VPL) is obtained as a percentage of the number of vehicles per direction (VPD), following this rule:

Number of lanes

PC distribution/lane

HT distribution/lane

(2 x 1)

VPL = 100% * VPD

VPL = 100% * VPD

(2 x 2)

Slow lane: VPL = 50% * VPD

Fast lane: VPL = 50% * VPD

Slow lane: VPL = 90% * VPD

Fast lane: VPL = 10% * VPD


Mean behavior of traffic flow

For both the LA,eq,1h and LA,eq,24h (and Lden) calculations, the mean traffic behavior can be defined using the (total) number of vehicles per direction (VPD) (i.e. PC + HT) and the percentage of HT.

+ Be careful not to confuse 'number of vehicles per direction' (VPD) and 'number of vehicles per lane' (VPL). In case of a (2 x 2) lanes, VPD is distributed on the 2 lanes of the corresponding direction (see example below).

 For example, one can consider the following conditions:

Number of vehicles
per direction (VPD)
Percentage of HT Distribution
of vehicles
per direction
Global traffic
(2 x 1) lanes
Global traffic
(2 x 2) lanes
20 000 10% PC: 18 000
HT: 2 000
40 000 40 000
20 000 15% PC: 17 000
HT: 3 000
40 000 40 000
10 000 10% PC: 9 000
HT: 1 000
20 000 20 000
10 000 15% PC: 8 500
HT: 1 500
20 000 20 000

Important remarks:

  • For the LA,eq,1h calculation, the traffic data are applied for a 1h-period.
  • For the LA,eq,24h (and Lden) calculation, the traffic data are applied over the 24h-period of the day. In this case, the daily percentage volumes of traffic (PC and HT) are defined as the mean values of the German and French volume of traffic, for PC and HT respectively. The mean traffic for Germany is the mean value based on nine different motorway counting points. The mean traffic for France is based on twenty seven counting points around the Ifsttar test tracks (at Nantes). Figures below show the mean values for PC (left) and HT (right).

User traffic data

For the LA,eq,24h (and Lden) calculation, users can use their own traffic data, for both the PC and the HT, by filling the corresponding spreadsheet.